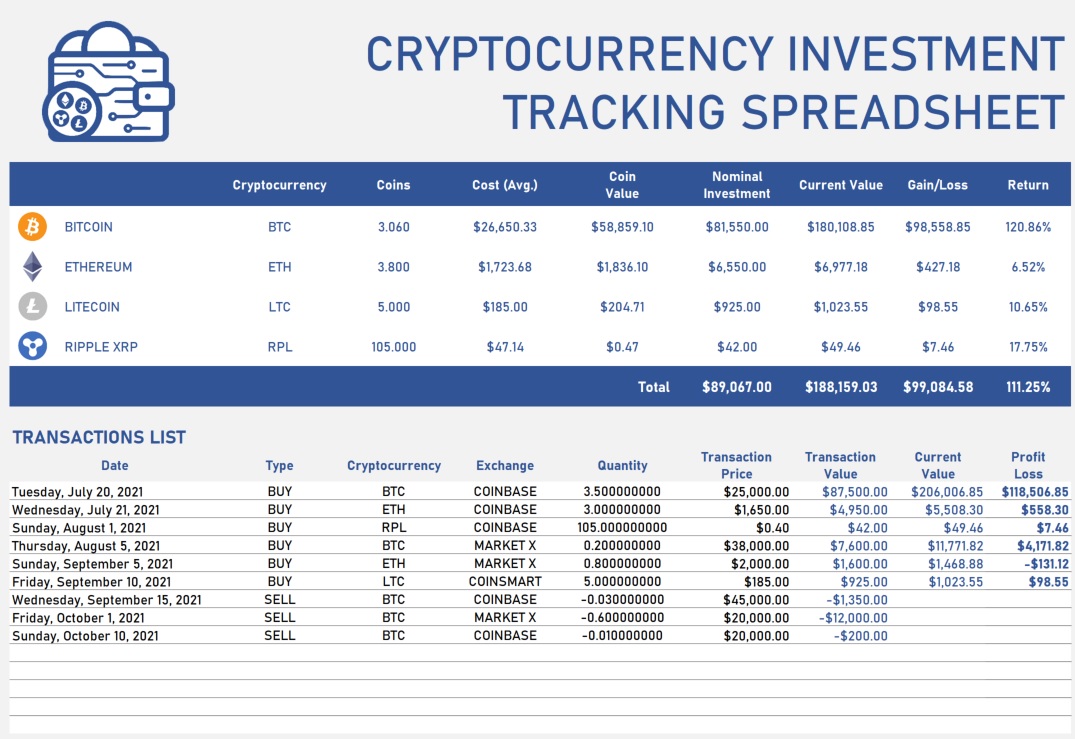
Fund managers and retail investors should use a crypto portfolio tracker template to monitor their crypto assets and investments. With this tool, you can effectively manage and analyze your investment holdings.
Furthermore, the Excel crypto portfolio tracker enables you to visualize market trends using charts and graphs. You can use it to pull in the live price of cryptocurrencies including;
- Bitcoin (BTC)
- Bitcoin Cash (BCH)
- Litecoin (LTC)
- Ripple (XRP)
- Ethereum (ETH)
Table of Contents
How to track a Crypto portfolio?
Consider the following ways to track gains and losses from crypto;
Use a Crypto portfolio tracker template
You can use the Excel template to create your crypto tracker. Excel has pre-built templates that have limitations. You need to manually input your cryptocurrency transactions in case you want to track the value of your portfolio. Thus, it can take you a lot of time and effort to keep your spreadsheet up-to-date.
Online profit calculators
Using a free online Crypto profit calculator is another way to calculate gains and losses from individual trades. This tool provides you with a comprehensive view of your crypto portfolio.
Use a crypto portfolio tracker software
The easiest way to track the value of your holdings is using a crypto portfolio tracker software. Across all of your cryptocurrencies, it provides you a live and up-to-date look at your gains and losses. You don’t need to manually enter your transactions.
How to create a Crypto portfolio tracker in Excel?
Let us discuss step-by-step how to create a crypto tracker in Excel;
Set up your spreadsheet
First, open Microsoft Excel and create a new spreadsheet. Depending on what metrics you want to track, label your columns such as Date, Cryptocurrency, Price, Total Value, and more.
Fetch live price data
To track your cryptocurrency, use Excel’s built-in STOCKS functionality. In addition, you need to pull in data from a third-party source if you want to track coins outside of the ones supported by Excel.
It’s up to you whether to select a reliable cryptocurrency data source with an Application Programming Interface (API) or use an extension like Crypto Sheets. Next, to understand how to fetch data, register for an API key, and review the documentation. Go to the Data tab and choose From Web in Excel to import data from the API. Connect to the API and retrieve live price data for selected cryptocurrencies by following the prompts.
Enter your crypto transactions
Enter relevant information for each of your transactions to track the value of your portfolio. This may include the name and amount of each holding cryptocurrency. Calculate the total value, percentage change, and other relevant metrics of your portfolio by using Excel formulas.
Generate cryptocurrency price charts
Go to the Insert tab and click on the ‘Recommended Charts’, then select a chart type. You can choose a line chart, area chart, or candlestick chart. Next, select the data range, dates, and corresponding cryptocurrency prices that you want to include in your chart. For clarity, you can customize the chart’s appearance and labels.
Set up data refresh
Set up automatic data refresh to make sure that your spreadsheet shows the latest cryptocurrency prices. Enable automatic refresh by choosing Queries & Connections in the Data tab.
Update your spreadsheet regularly
Update your spreadsheet periodically to ensure accurate and up-to-date information.
FAQ’s
A crypto portfolio tracker is a platform that allows investors to track the ever-changing value of different coins such as Bitcoin (BTC), Bitcoin Cash (BCH), Litecoin (LTC), etc.
Yes, Excel supports live cryptocurrency prices. You need to pull in prices through an API connection with a crypto price tracker to see the price of more cryptocurrencies.


