An Excel chart template is a useful tool that contains a professionally designed library of Excel graphs and charts. You just need to provide your data in these pre-built templates and the graph or chart will automatically generate.
Table of Contents
Different types of Excel chart templates:
You can find several types of Excel chart templates online;
Gauge chart
A gauge chart template is used to compare KPIs or business results against a plan value. It has a combination of a pie and a doughnut chart. This chart provides more flexibility and shows multiple KPIs. Moreover, it is also known as a dial chart and speedometer chart.
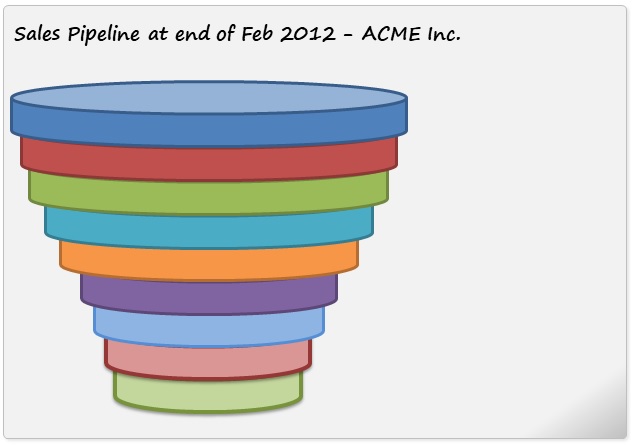
Sales funnel template
A sales funnel template uses a combination of an area chart and a scatter plot. It displays the values in descending order i.e. from largest to smallest.
Mekko chart
A Mekko chart or Marimekko chart is used to look at the overall market. This powerful tool helps you to understand each part or bar’s relationship to the total. The graph uses a variable-width 100% stacked bar chart that breaks down a market by combining multiple bars into a single map.
Progress circle chart
A progress circle chart is usually used to save space on the main dashboard screen. The chart shows your progress towards a goal.
Progress bar chart
This chart, also known as a score meter template, displays the actual value on a percentage scale. Use a stacked bar chart to create it in a few simple steps.
Panel chart
This Excel chart template has multiple regions. Instead of showing all data in a single area, each region displays a different set of data.
Waterfall chart template
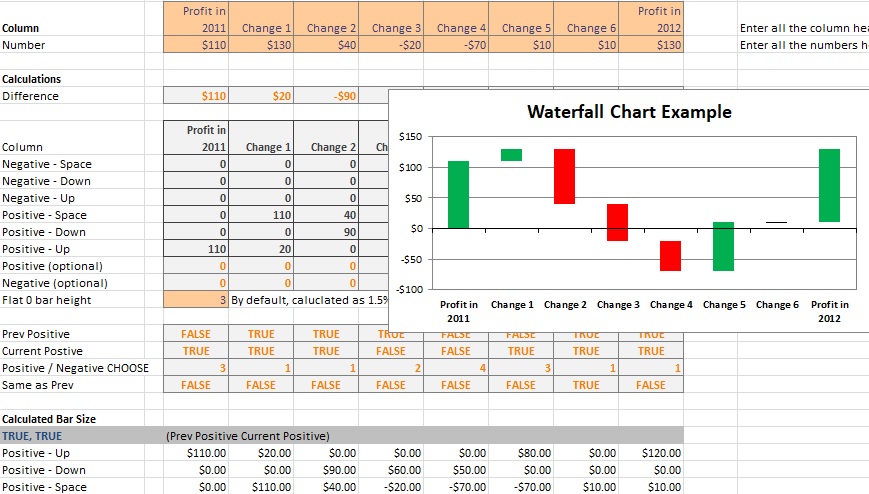
Individuals frequently use a waterfall chart to support financial reports. Other names of this chart are;
- Bridge Chart
- Flying Bricks Chart
- Cascade Chart
- Mario Chart
Tornado chart
A tornado chart is a modified bar chart version that helps you create quick comparisons. It displays data categories vertically in a way that looks like a tornado.
Quadrant chart
A quadrant chart uses a scatter plot with a background of four equal sections. It enables you to classify data points into four quadrants.
Bullet chart
A bullet chart, also known as Steven Few’s Bullet Graph, transforms data to show actual versus target using bands. You can use it to track performance(s) against goal(s).
Org chart
The org chart is a powerful tool that can speed up your daily work and routine tasks.
Pareto chart
The Pareto chart is a hybrid of column and line charts that demonstrates the relative weight of the analyzed factors. Rather than working on less critical fields, a few improvements in the key factors can bring larger outcomes.
Polar plot template
The polar plot template is an effective tool if you want to analyze the service level performance.
Ogive chart
The ogive chart is used in statistics to demonstrate cumulative frequencies. This chart is also known as the cumulative frequency graph.
Step chart
This Excel chart template has vertical and horizontal lines to link data points in a series. This line chart builds a step-like progression.
Plan actual variance chart
Use the variance chart template if you want to create an eye-catching visualization for plan versus actual purposes. You can see the differences between the plan and actual values month by month through this variance chart.
Some other types of Excel chart templates include;
- Sparklines
- Dumbbell chart
- Dynamic charts
- Interactive chart tooltips
- Traffic light Excel chart template
- Waffle chart template
- Multi-Layer Doughnut Chart
- Stem and leaf plot
- Candlestick charts
- Timeline chart
- Population pyramid
- Normal distributive curve
Body Mass Index (BMI) Charts Template
Free Excel Chart Template
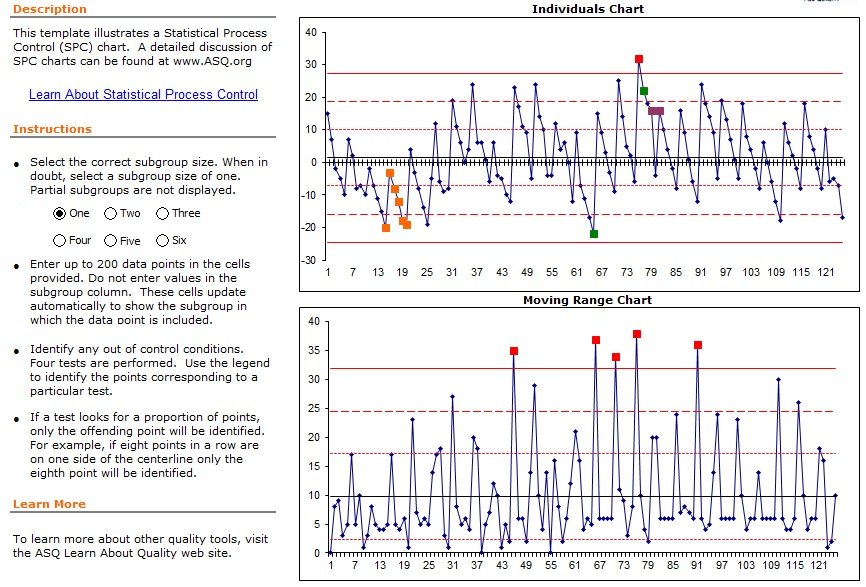
Control Chart Template
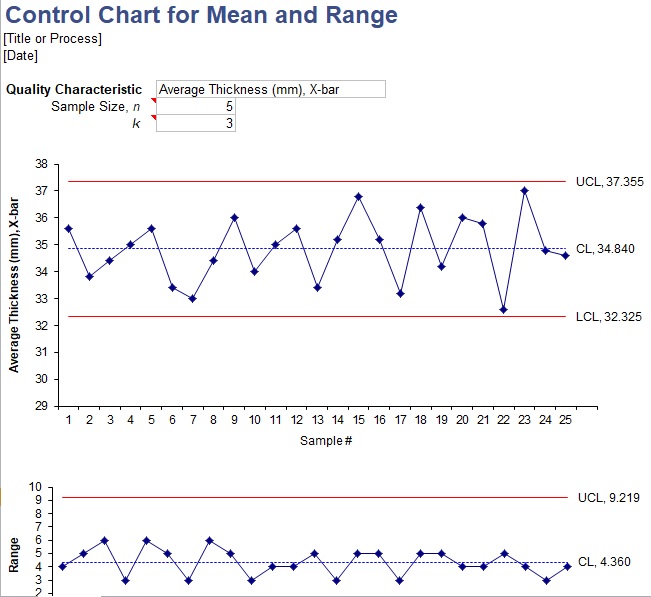
Control Run Chart Template for Mean and Range
Dynamic Chart Template
Help HQ Waterfall Chart Template
Pareto Analysis Chart Template
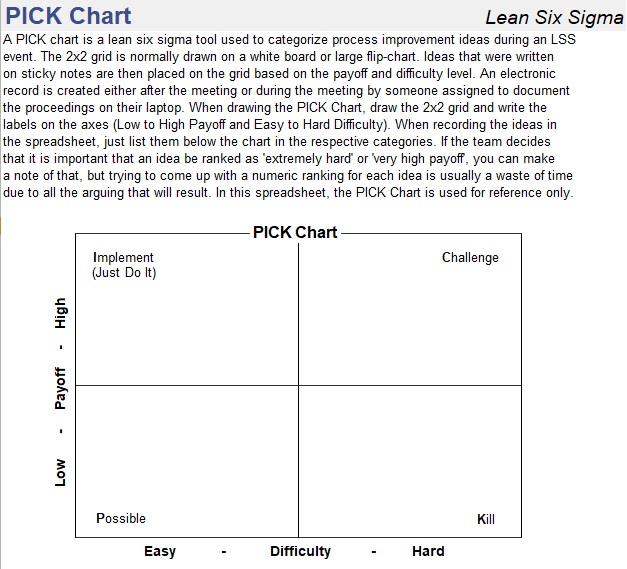
Pick Chart Template
Reward Chart Template for Kids
Rotate Pie Chart Template
Sales Funnel Chart Template
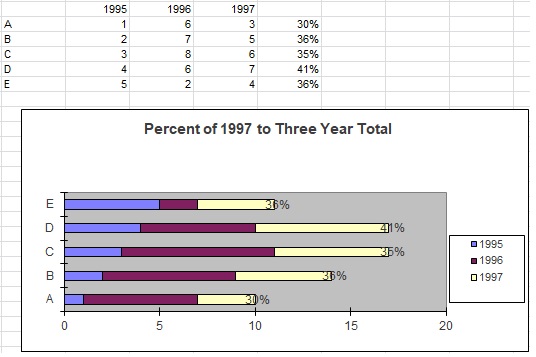
Stacked Chart Template
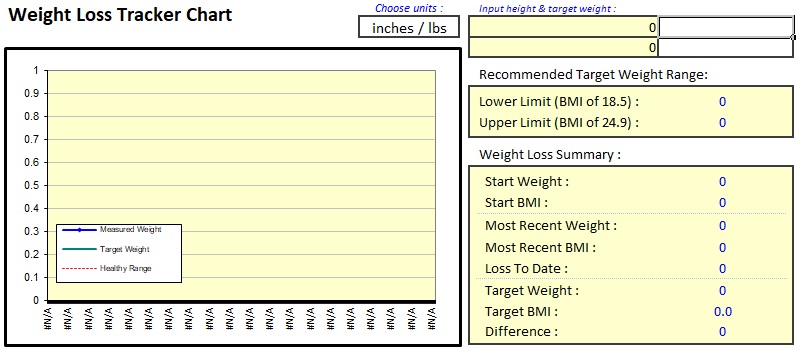
Weight Loss Chart Template
How to use Excel chart templates?
Consider the following steps;
- Collect the data that you want to display.
- Under the Insert tab, click on ‘Recommended Charts.’
- Choose the All Charts Tab
- Select the Template
- Click OK
FAQ’s:
Which properties should I customize before saving a chart as a template?
These are as follows;
- Chart Title
- Colors
- Gap with
- Axis
- Legends


