A Gantt chart template is a tool that helps you manage your projects effectively. With this tool, you can organize project tasks on a visual timeline. The project management uses the Gantt chart to sketch project plans and major milestones.
Table of Contents
What is a Gantt chart template?
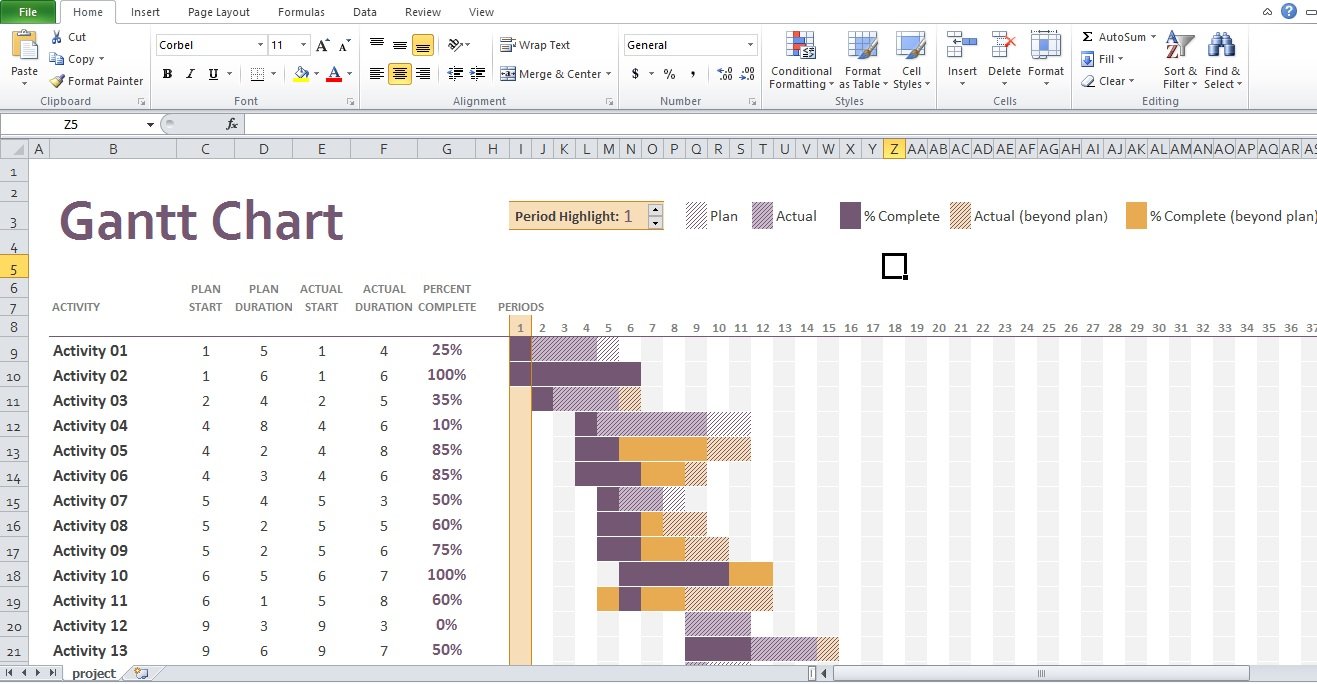
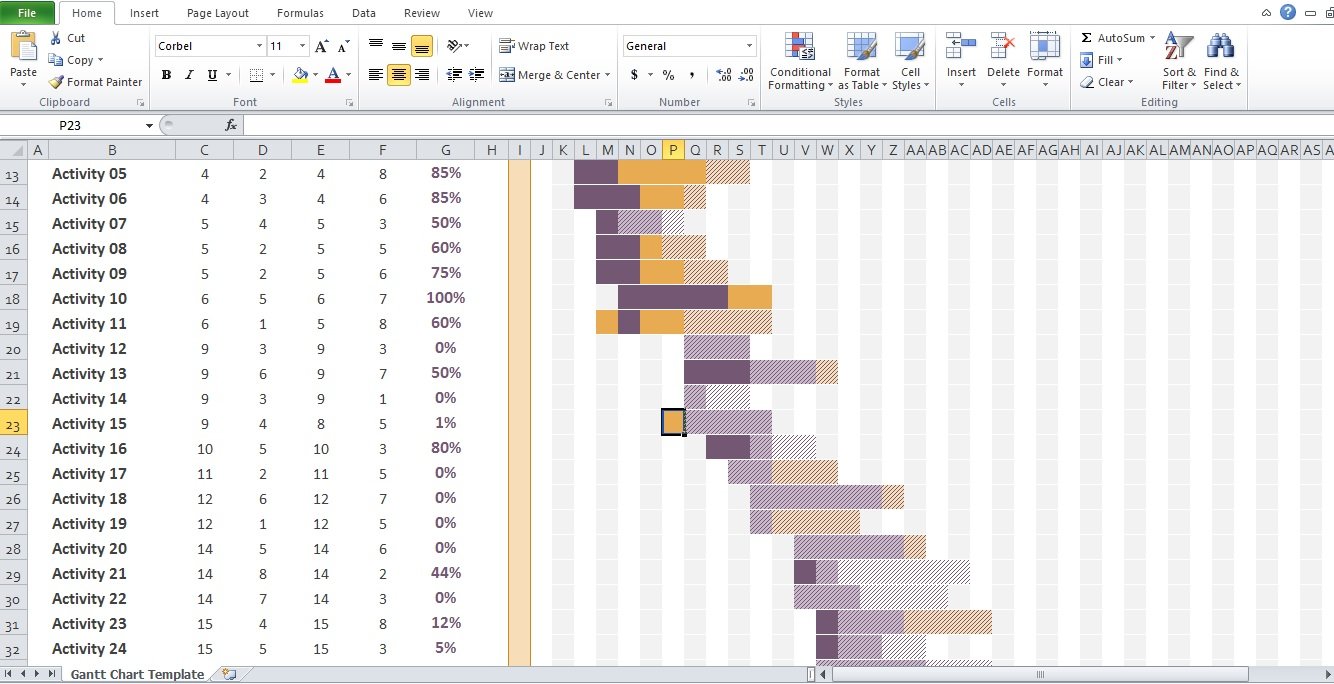
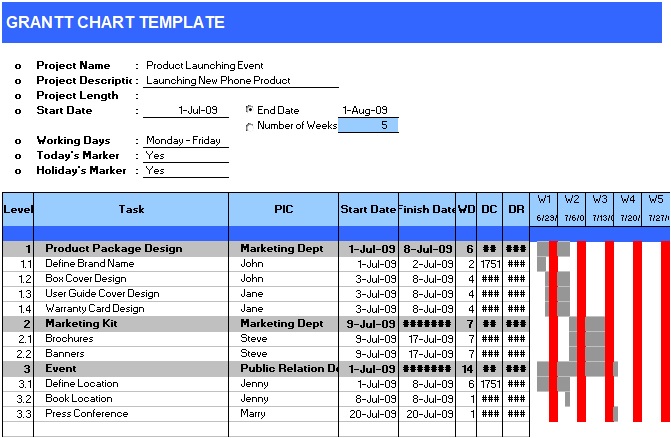
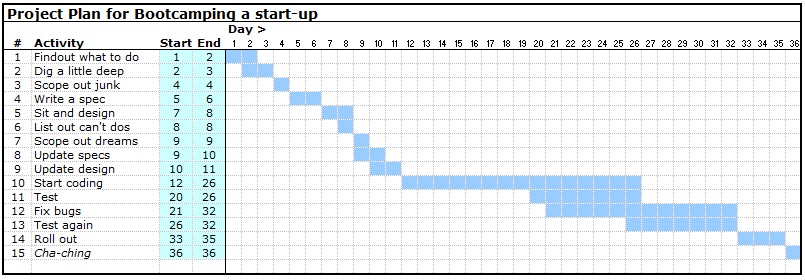
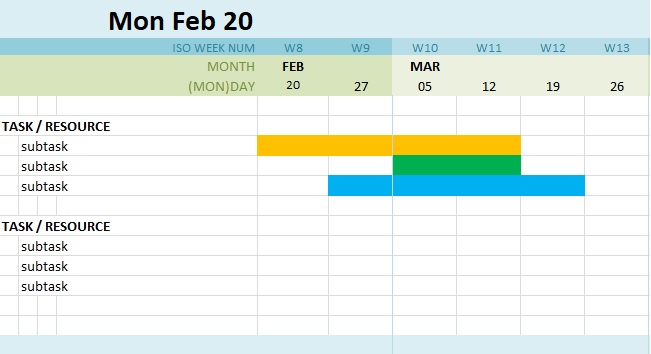
A Gantt chart template is a graphic representation of all the tasks and activities in an ongoing project. It helps the project managers to keep track of development. In the chart, a series of horizontal lines display the quantity of work completed within a certain time frame. The horizontal bars that show the timelines and tasks are referred to as Gantt bars because of their similarity to a stacked bar chart.
Furthermore, Gantt charts are often used throughout projects, programs, and portfolios once the tasks have been specified. It represents the anticipated task against the time needed to complete the task.
A Gantt chart can also be used for;
- Assigning tasks to each team member
- Establishing time limits
- Calculating costs automatically
- Keeping track of progress in real-time
The basic components of a Gantt chart template:
Here are the basic components of a Gantt chart template;
- List of tasks: On the left side of the Gantt chart, tasks run down a vertical axis to specify project activity.
- Time frame: In a horizontal bar across the top of the Gantt chart, mention months, weeks, days, and years. This indicates the time frame the project is expected to take.
- Timeline: The vertical line on the Gantt chart represents the date you complete tasks.
- Bars: In most programs, horizontal markers or bars on the right side of the Gantt chart display tasks, display status, duration, and start and end dates.
- Milestones: Different symbols can be used to identify and mark milestones.
- Dependencies: Light gray lines or arrows are used to connect the tasks that need to be completed in a specific order.
- Movement: Use a percentage or bar shading to indicate how far along the task is and may do so.
- Resourcing allocated: Along with the resources and materials required to complete the job, determine the individual or group in charge of completing a task.
Creating a Gantt chart in MS Excel:
Creating a Gantt chart in Excel requires a bit of effort because there isn’t any built-in Gantt chart tool in MS Excel. Consider the following steps to create the template;
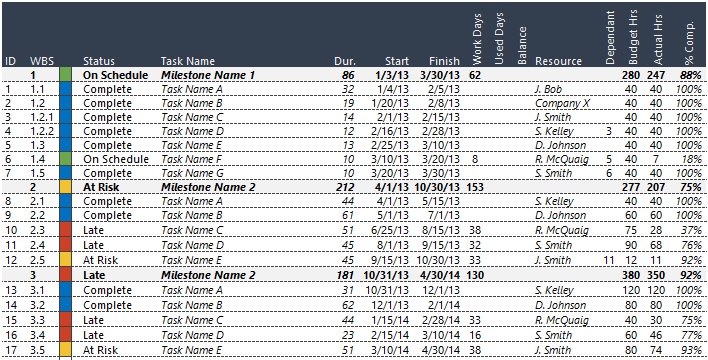
Create a project table
Create a table with four columns to list your project tasks. The rows and columns that you want to display in your table, highlight them. To identify each task’s length, add a formula (deduct the end date from the start date).
Draft a stacked bar chart
Create a typically stacked bar chart with the information from your project table. Choose the data first that you want in your bar chart. You can give your bar graph a project title after creating it.
Change data in your Excel file
Right-click your stacked bar chart to edit the axis labels, select Edit from the insert menu, and then order your data by categories.
Format your Excel Gantt chart
If you want to convert a stacked bar chart into a Gantt chart template timeline then you must structure it to display the taskbars of a Gantt view.
Where can you use a Gantt chart?
A Gantt chart can be used by any sector or field to identify deadlines and job dependencies. Different organizations use it to visualize the numerous tasks and projects that are carried out simultaneously inside it. They usually use it to plan and schedule the projects.
Moreover, a Gantt chart can be used in the following scenarios;
Project management
Gantt chart collects data to present all of a project plan’s components in one location which the project managers use to produce a visual timeline. In the Gantt chart template, the project managers can do the following;
- Schedule projects
- Allocate resources
- Establish costs
- Include a sales process timeline
Construction
General contractors, project owners, and construction project managers can use the Gantt chart template to plan the many phases of a construction project. This may include initiation, pre-construction, and procurement.
Software development
Software engineering teams use the Gantt chart template to build project roadmaps. When creating new products, this is essential for task management.
Gantt Chart Excel Template Free Download
Gantt Chart Excel Template XLS
Free Gantt Chart Template
Making a Gantt Chart in Excel
Simple Gantt Chart Template
Editable Gantt Chart Template
Weekly Gantt Chart Excel Template
Monthly Gantt Chart Excel Template
The benefits and drawbacks of a Gantt chart template:
The benefits
A Gantt chart helps you determine potential delays within the project timeline. It is a valuable tool to track progress and allocate resources. It gives a clear and visual depiction of the plan. For employees, it acts as a communication tool that makes it easier to manage projects.
Drawbacks
The Gantt charts don’t show dependencies on their own. The timetable size has a limit that can be read and understood. In addition, these charts are prone to errors and aren’t adaptable to change readily.
FAQ’s
1- Identify the approximate duration of each task.
2- Select the sequence in which the several tasks should be completed.
3- Determine the areas where you lack resources.
4- Identify the timeline of the tasks that will take too long to complete.
5- Find out the places where the schedule needs improvement.
6- Consider the situation and issues you may face if something goes wrong.
You should use a Gantt chart template in the following scenarios;
1- When you want to keep track of your employee’s progress and task duration be precise.
2- A visual breakdown of the project’s progress is requested by a supervisor, client, or team member.
3- You have to manage the workloads of your team members who are involved in many projects.
4- You want to know the timeline that each task should or might take.




![PERT Chart Templates & Examples for Word, PDF, Powerpoint [FREE]](https://exceltmp.com/wp-content/uploads/2019/11/free-pert-chart-template-150x150.jpg)
