In this article, you will get knowledge about Pert Chart Template. There are two main project evaluation and management techniques. CPM (Critical Path Method) and PERT chart template excel (Project evaluation and review technique). In CPM; a network of activities is constructed to determine the critical path, project completion time, Critical activities, and non-critical activities.
There is a slight difference between the CPM and PERT method. In CPM all activities timings are deterministic.
Whereas in PERT each activity has three-time estimates,
- Optimistic Time (Shortest possible time)
- Most Likely Time (Most probable time)
- Pessimistic Time (Longest time)
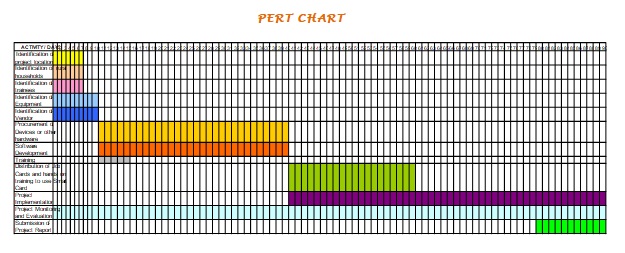
PERT chart is graphical representations of project activities as network diagrams used for schedule organizes and coordinate activities within a project. You may also like Projected Income Statement Template.
Table of Contents
What is the Importance of a PERT Chart Template?
PERT technique is used to find critical path, project completion time, critical and non-critical activities of the project. Forward Pass (Earliest Start Time) and Backward Pass (Latest Completion Time) methods are used for the determination of critical path and critical activities in the PERT technique.
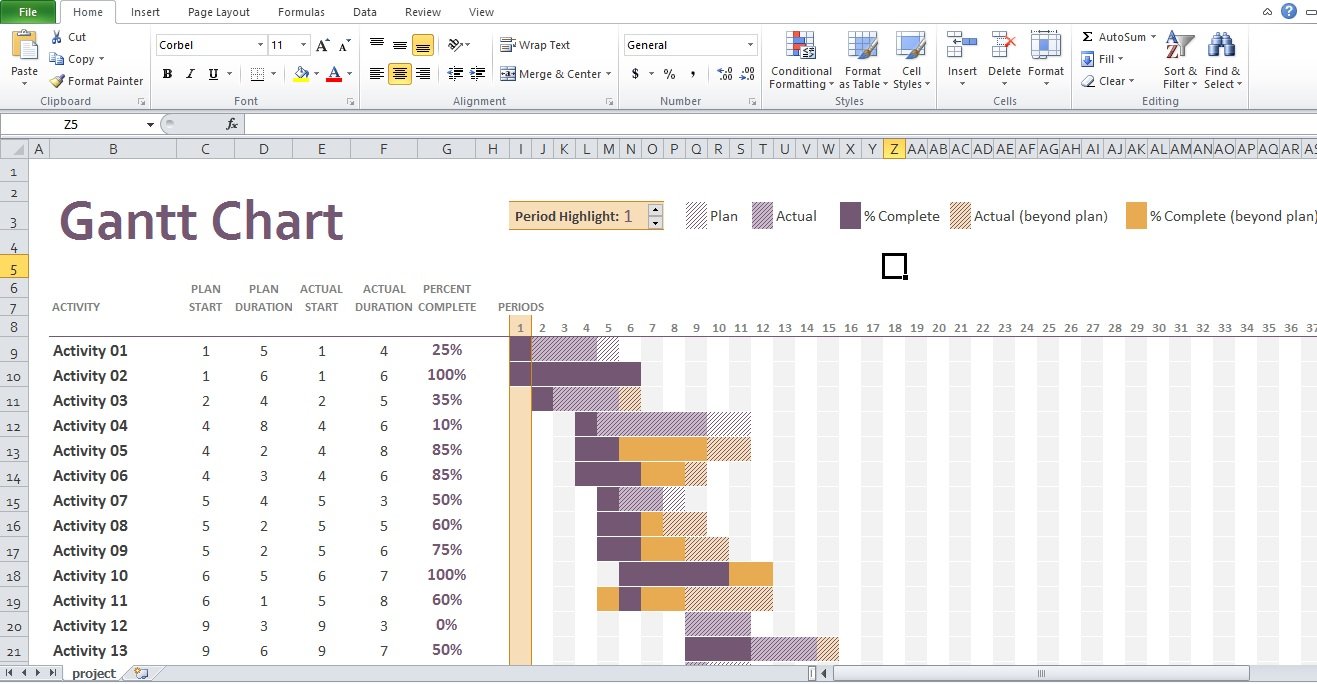
PERT chart clearly illustrates activity dependencies that are easy to interpret in comparison to the Gantt chart which is also considered an important tool in project management, but it becomes complex in longer projects. PERT uses three-time estimates instead of just one to find out mean or expected completion time of each activity which is more accurate than the time taken in the CPM method. You may also see Project Management Timeline Template.
The key advantage of PERT charts over other tools is easy to visualize and complex projects with a large number are organized well by illustrating the dependencies links between each activity of the project.
One can make Free PERT Chart Template (Word, PDF) by following steps mentioned in the next sections which can be modified later according to their project requirement. You may also check the Recruitment Strategy Template.
How to make a PERT Chart Template?
PERT chart is a graphical network type illustration of project activities linked based on their dependencies for easy visualization and organization of project activities.
There are few terminologies to understand before heading toward making PERT Chart Template Xls file using Microsoft Excel,
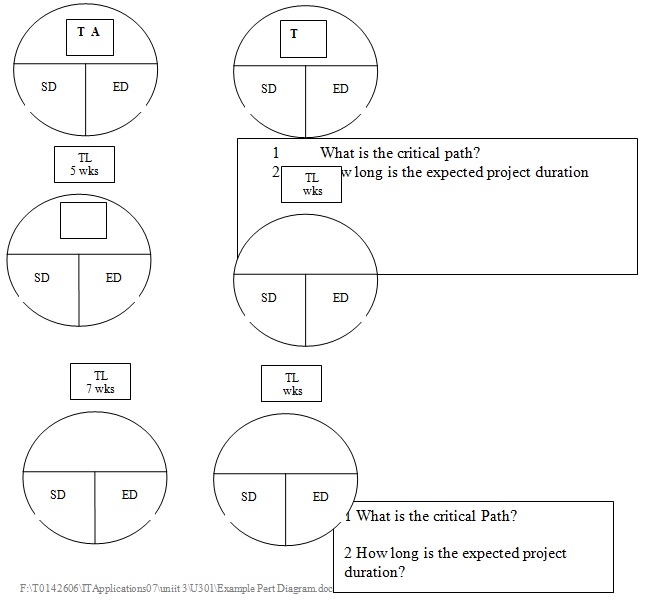
- PERT Event: PERT milestones or events are represented by nodes. Numbered circles or numbered boxes are a graphical representation of nodes. It shows the start or completion of activities and consumes no time and resources.
- PERT Predecessor Event: An event comes before another event is the predecessor event. There can be multiple predecessors of an event, or it can precede many other events.
- PERT Successor Event: An event that comes right after another event is its successor event. There can be multiple successors to an event, or it succeeds in many other events.
- PERT Activity: It’s the actual task that consumes time and resources. It can’t be performed until the predecessor milestone has occurred.
- Expected or Mean Time: It is the most realistic time required for completion of the particular activity.
Additional Reading About What is the PERT chart?.
Simple Pert Chart Template
Pert Chart Template Word Download
Download Pert Diagram Template
Free Pert Chart Template
Pert Chart Template Microsoft Project
Pert Chart Template Example
Pert Chart Template Sample
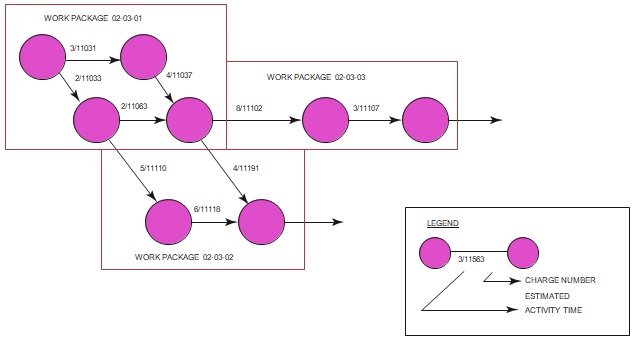
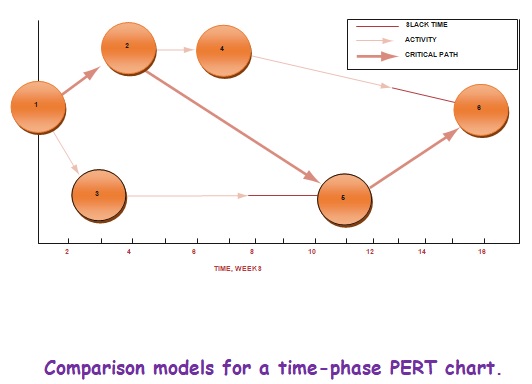
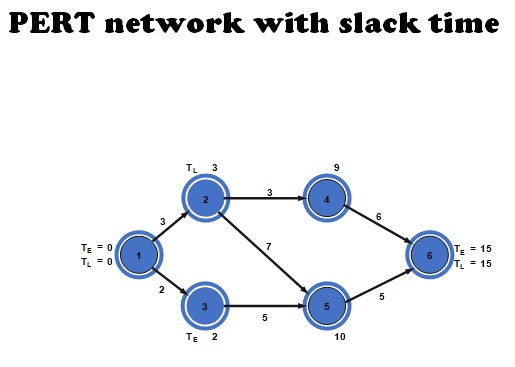
All the above information can also be graphed as a PERT Chart Template word file format representing events as numbered circles or boxes. Activities are represented by dimensional arrows whose head pointing toward successor event and tail pointing at predecessor event. You may also like the Class Schedule Template.
Activity description or number should be written over the arrow body with mean completion time. PERT chart can be further used after applying forward and backward pass methods to find out key requisites of project management.

